Connect with us


Education has always been the foundation of human progress. From ancient scholars gathering in courtyards to modern classrooms filled with eager learners, the pursuit of knowledge...
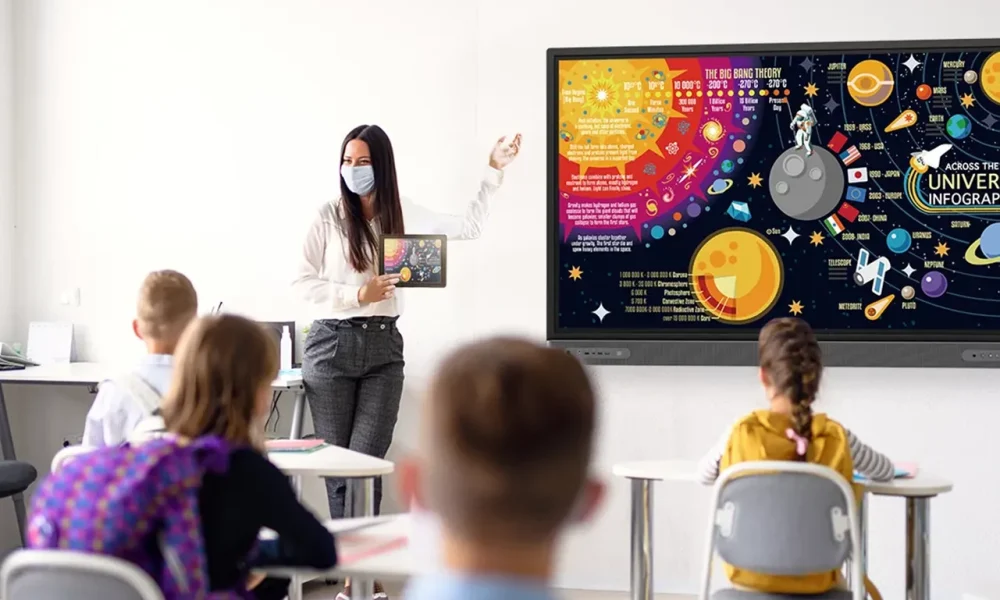


In the last two decades, technology has transformed nearly every aspect of our lives—and education is no exception. From smartboards and tablets to artificial intelligence (AI)...


In the past two decades, the fusion of technology and education has dramatically transformed the way knowledge is delivered, accessed, and experienced. What was once confined...


Education has always been a cornerstone of human progress. From the earliest oral traditions to the invention of the printing press and mass schooling, each era...


Sorting data in Excel is one of the most fundamental tasks for data analysts and business owners. While most are accustomed to the default vertical sorting,...


Would you like to show progress on a KPI by putting a nice progress bar into your report? In this tutorial I’ll show you a very...
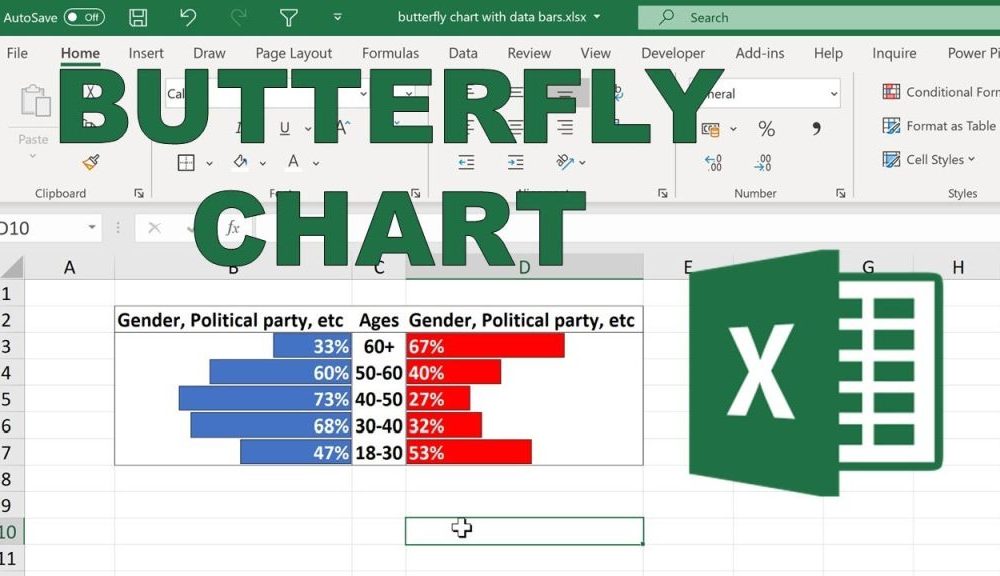
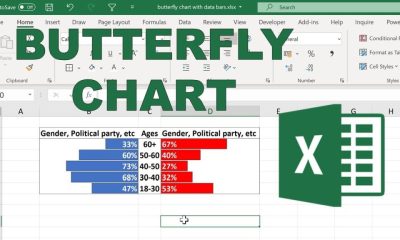

Data visualization is a powerful way to uncover patterns, make data-driven decisions, and communicate insights effectively. One lesser-known but highly effective chart that can transform your...

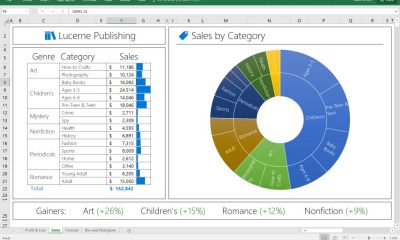
Sunburst chart is a nice way of presenting relational datasets together in a compact form. This chart type is very strong in summarizing data but can...


Summary: The blog summarizes the methods to repair MS Excel workbook and explains various benefits that each procedure offers. It also describes a third-party Excel Repair...

Data visualization is essential for anyone working with data. Among the numerous tools available, bar charts are a popular choice for presenting information clearly and effectively....