


Microsoft Excel is more than just a spreadsheet tool; it is a powerful platform for building customized calculators that can make your daily tasks easier and...


Sorting data in Excel is one of the most fundamental tasks for data analysts and business owners. While most are accustomed to the default vertical sorting,...


Slicers is a very useful but underutilized tool in Excel. You can dynamically filter your pivot tables and pivot charts with animated buttons, aka slicers. For...
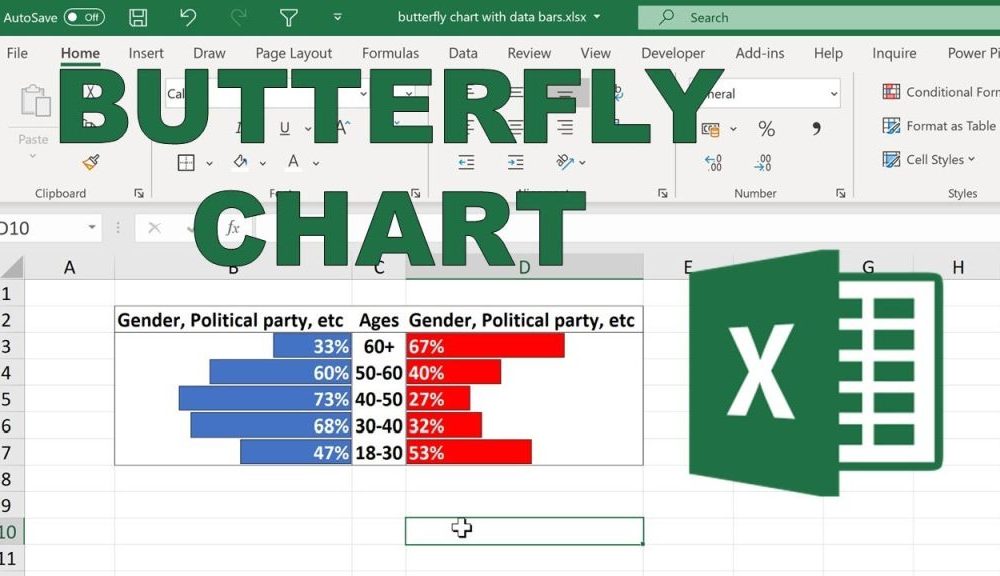

Data visualization is a powerful way to uncover patterns, make data-driven decisions, and communicate insights effectively. One lesser-known but highly effective chart that can transform your...


Summary: The blog summarizes the methods to repair MS Excel workbook and explains various benefits that each procedure offers. It also describes a third-party Excel Repair...

Data visualization is essential for anyone working with data. Among the numerous tools available, bar charts are a popular choice for presenting information clearly and effectively....


Excel has become a linchpin in modern data management, analysis, and reporting. It’s a tool that businesses and professionals depend on daily. Within Excel lies a...
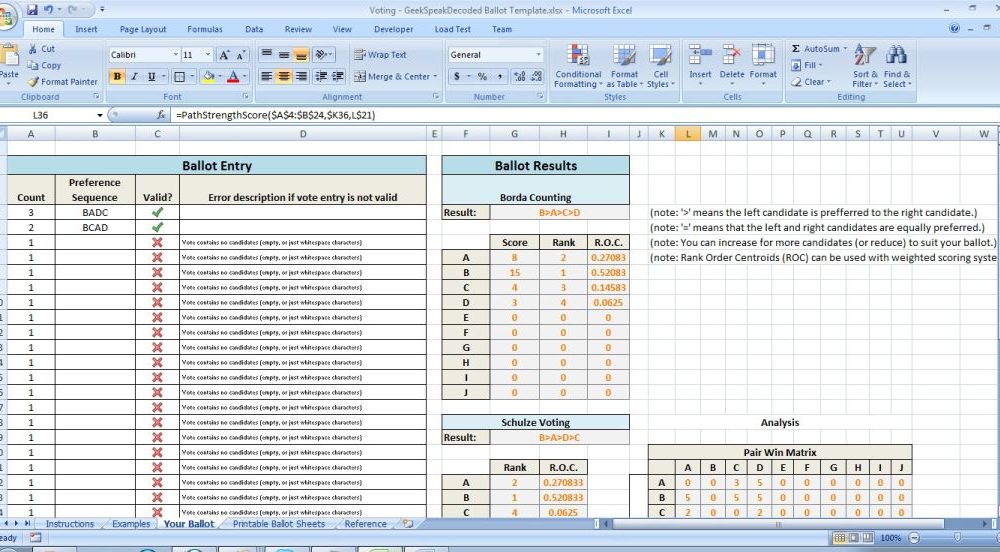

Here is an Excel election template that you can use for the elections held at your organization. It has a practical vote entry sheet and a...
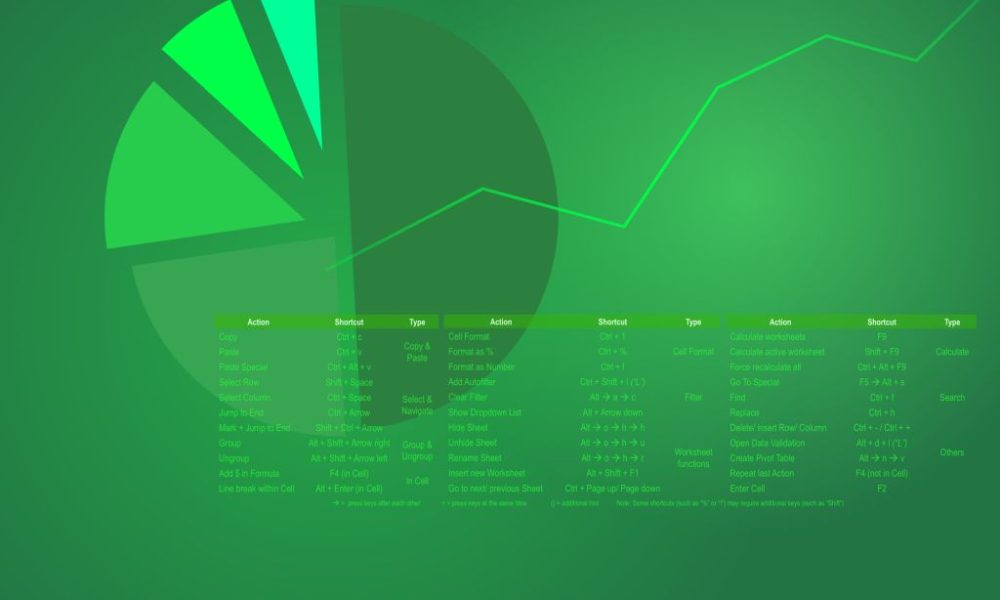


Do you need an Excel Gantt Chart to track progress of your project or plan or production schedule? Here is a very quick and easy way...
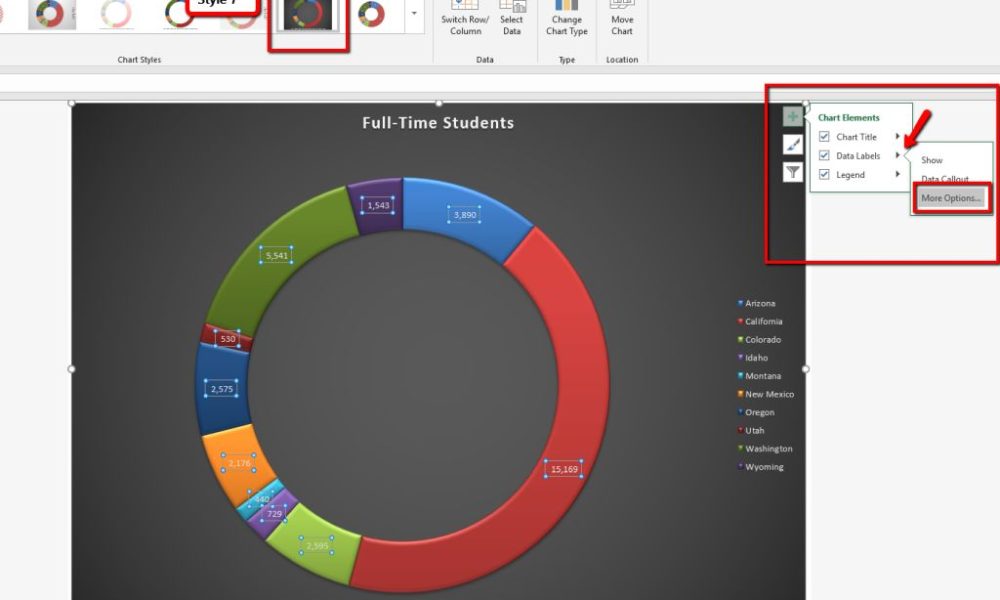
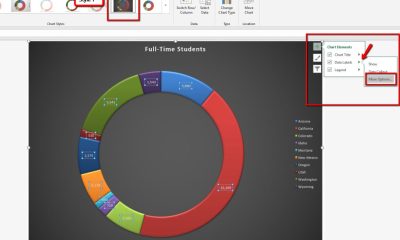

Charts are more than just decorative visuals—they’re powerful tools for translating raw data into digestible insights. However, the key to building effective charts lies in mastering...