Connect with us

The health and wellness industry are thriving, and supplement brands are at the forefront of this growth. But how do these brands stand out in a...


Sorting data in Excel is one of the most fundamental tasks for data analysts and business owners. While most are accustomed to the default vertical sorting,...


Slicers is a very useful but underutilized tool in Excel. You can dynamically filter your pivot tables and pivot charts with animated buttons, aka slicers. For...


Pivot tables are one of the most powerful tools in Excel, enabling data analysts and business owners to organize and summarize large datasets into meaningful insights....
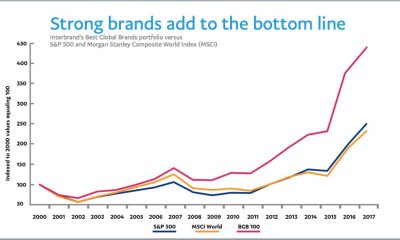
When one value on your chart is much higher than the rest, lower values on your chart might become unreadable. In this tutorial, you will learn...


Would you like to show progress on a KPI by putting a nice progress bar into your report? In this tutorial I’ll show you a very...
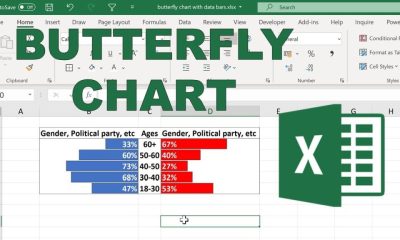

Data visualization is a powerful way to uncover patterns, make data-driven decisions, and communicate insights effectively. One lesser-known but highly effective chart that can transform your...

There can be times that you need to create top 10 lists that can be filtered independently from other worksheets along with many other tables and...
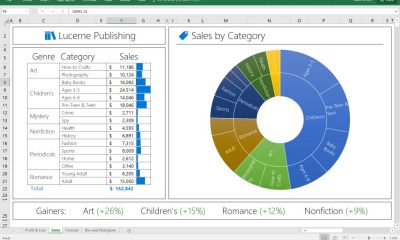

Sunburst chart is a nice way of presenting relational datasets together in a compact form. This chart type is very strong in summarizing data but can...


Summary: The blog summarizes the methods to repair MS Excel workbook and explains various benefits that each procedure offers. It also describes a third-party Excel Repair...


