Education
Word Cloud Generators: The Modern Tool for Simplifying Data Visualization
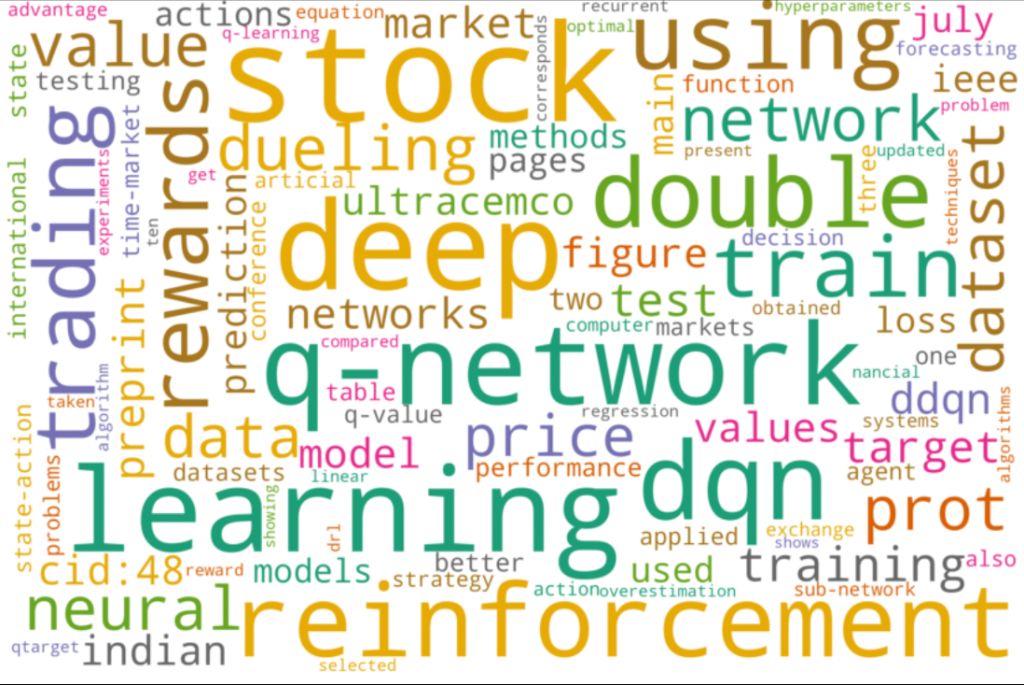
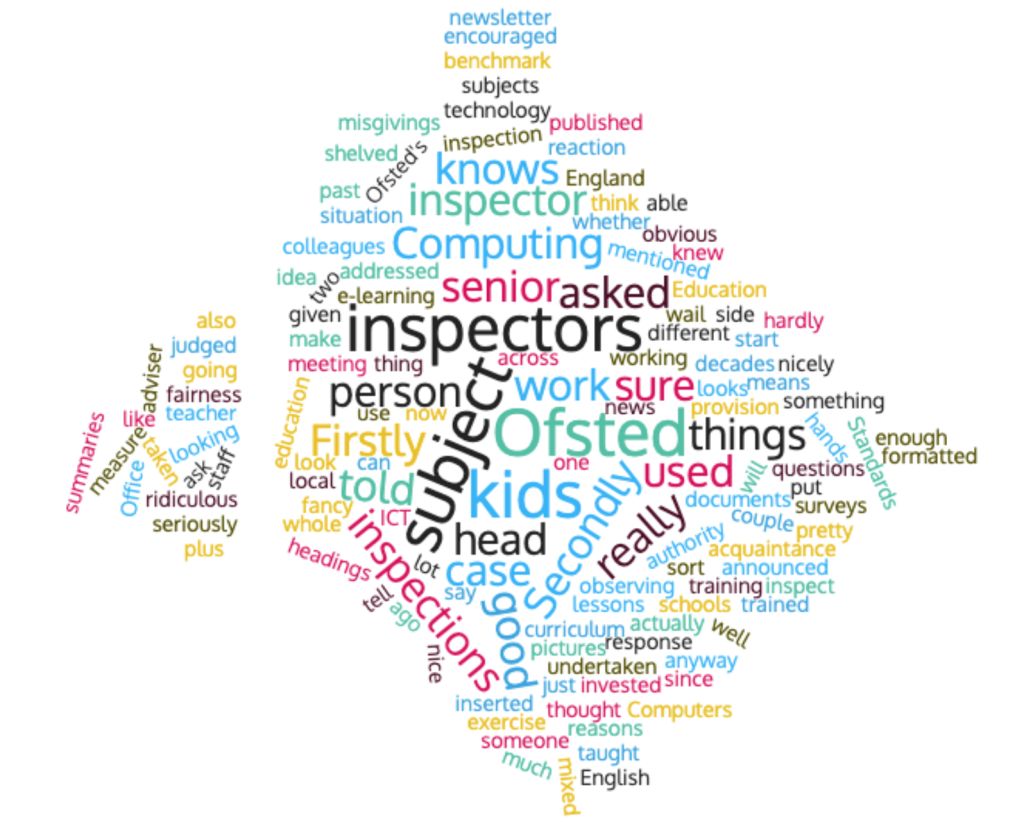
Ever wondered how to make data look more exciting, digestible, and engaging? Enter the word cloud—a visual representation of text data where the size of each word indicates its frequency or significance. Whether you’re a content creator designing captivating visuals, an educator breaking down complex ideas, or a professional analyzing trends, word clouds are a simple yet powerful tool to distill large amounts of information into something visually compelling.
This post dives deep into the world of word cloud generators, exploring their applications, benefits, and best practices, and even offering a step-by-step guide to creating your own. By the end, you’ll know how this innovative tool can add value to your projects and boost your creativity.
What Are Word Clouds and Why Are They Useful?
A word cloud is a visual technique for displaying text-based data, where commonly appearing words stand out by being larger or bolder. It’s both functional and artistic—a blend of data visualization and design.
Key Applications of Word Clouds
- Content Analysis – Identify recurring themes in a dataset, article, or survey.
- Data Visualization – Present information in a way that grabs attention and tells a story at a glance.
- Brainstorming – Quickly capture thoughts, keywords, or ideas for projects or campaigns.
- Engagement Tool – Spruce up presentations, blogs, or social media posts.
Word clouds cater to diverse needs, whether you want to identify your top-performing keywords in a blog post or simplify complex text for a broader audience.
Why Use Word Cloud Generators?
Creating word clouds manually is tedious and time-consuming. That’s where word cloud generators save the day. These tools automatically process your text, analyze word frequencies, and generate vibrant visuals in just a few clicks.
Benefits of Using a Word Cloud Generator
- Simplifies Complexity – Break dense data into readable, engaging visuals.
- Customizable Design – Transform text into creative and personalized outputs.
- Quick and User-Friendly – Generate professional-quality visuals without technical skills.
- Enhanced Engagement – Make your audience pay attention to important words by highlighting them dynamically.
By using a word cloud generator, you can present abstract data like survey results, feedback, or classroom concepts in a visually compelling way.
How to Use a Word Cloud Generator
Using a word cloud generator is a straightforward process that even beginners can master. Follow these simple steps to create your own:
Step 1. Choose the Right Tool
Pick a reliable word cloud generator to suit your needs. Popular options include WordClouds.com, Tagul, and WordArt. Tools differ in functionality, so explore a few to determine the best fit.
Step 2. Input Your Data
Upload your text directly to the platform, paste it into the text input box, or upload a file containing your text. For example, upload survey results, paste text from a blog post, or input keywords from a brainstorming session.
Step 3. Customize the Design
Choose your preferred:
- Font style and size
- Color scheme (stay on-brand where possible)
- Layout (circular, rectangular, scattered)
Make sure the design matches your content’s purpose. For instance, keep it professional for presentations or playful for classroom use.
Step 4. Exclude Unnecessary Words
Set filters or stop-words to exclude irrelevant terms (“and,” “the,” “or”) and highlight only meaningful words.
Step 5. Save and Share
When you’re satisfied with your word cloud, save it in your desired format (PNG, JPEG, PDF). Share it in presentations, embed it in blogs, or print it as part of your teaching materials.
Best Practices for Crafting Effective Word Clouds
Now that you know how to create a word cloud, make the most of it with these best practices:
1. Choose the Right Words
Use clean, focused data. Avoid overloading the generator with unnecessary text or unrelated terms.
2. Highlight Key Themes
Identify the most critical ideas or terms you want to emphasize and ensure they are included prominently.
3. Play with Layout
Test different layouts and orientations to find the style that aligns best with your message.
4. Stick to a Cohesive Color Scheme
Ensure your word cloud’s colors align with your brand or the tone of your project. Use contrasting colors for better readability.
5. Use Word Clouds as a Complement
While word clouds are engaging, they should supplement— not replace—detailed explanations. Pair them with well-structured written or spoken content.
Real-World Applications of Word Clouds
Wondering where word clouds shine? Here’s a glimpse of their real-world applications:
Business
- Presentations – Highlight survey findings or feedback trends for stakeholders.
- Marketing – Analyze consumer sentiment, keywords, or brand mentions across platforms.
- Brainstorming – Visualize team ideas during workshops or innovation sessions.
Education
- Classroom Activities – Help students summarize texts or visualize vocabulary.
- Teaching Materials – Display concepts from lessons in an interactive, memorable layout.
- Feedback – Use student or parent feedback to identify recurring themes.
Social Media
- Content Creation – Add a creative, colorful element to Instagram, Pinterest, or Facebook posts.
- Community Engagement – Use word clouds for polls or discussions to visually highlight the most popular suggestions.
From summarizing annual reports to breaking down abstract concepts, word clouds add life to your data.
Boosting SEO with Word Clouds
Word clouds can even play a subtle role in improving your SEO efforts:
- Keyword Spotting – Identify frequently occurring terms from competitors’ or your own content and weave them strategically into your blog posts.
- Content Engagement – Visual elements like word clouds enhance content sharing and engagement.
- Better Internal Linking Choices – Use visually highlighted words to identify anchor text opportunities for internal links.
By integrating word clouds into your strategy, your data-driven insights look fresher and more optimized.
Bring Your Words to Life Today
Word clouds are more than just fun visuals—they are a multi-purpose tool designed for creativity, clarity, and communication. Whether you’re brainstorming ideas, simplifying data for students, or revamping your content strategy, word cloud generators make the process quick and effective.
Why leave your words static and unengaging? Start experimenting with a word cloud generator today and transform how you present your data— one cloud at a time.
Meta Data
Meta Title
How to Use a Word Cloud Generator to Simplify Data
Meta Description
Learn how to create word clouds to visualize data, simplify content, and enhance SEO. A step-by-step guide, best practices, and real-world examples enclosed!


Education has always evolved alongside society, but never has its transformation been as rapid, profound, and far-reaching as it is today. Technology has become one of the most influential forces reshaping the way we teach, learn, and prepare for the future. Classrooms are no longer limited by walls, schedules, or geography. Instead, learning has expanded into a dynamic, interactive ecosystem powered by digital tools, intelligent systems, and real-time global connectivity.
From AI tutors and immersive simulations to cloud-based collaboration and personalized learning pathways, technology is redefining education for learners of all ages. In this article, we explore the innovations driving this revolution, the new opportunities they create, and the challenges educators must navigate to build a more inclusive, empowered future for global learning.
The Shift Toward a Digital-First Learning Environment
The digital revolution has expanded learning far beyond traditional classrooms. Technology allows education to flow seamlessly across devices, locations, and schedules, turning the world into a network of learning opportunities.
1. Online Learning as a Mainstream Standard
Online education is no longer an alternative—it’s a core part of modern learning. Students today engage with:
-
video lectures
-
interactive modules
-
virtual classrooms
-
digital discussion forums
-
real-time one-on-one sessions
Platforms like Coursera, Khan Academy, Udemy, and institutional LMS systems provide high-quality resources to millions, often for free or at low cost. This democratization of education means knowledge is more accessible than at any other time in history.
2. Mobile and On-the-Go Learning
Smartphones and tablets have transformed microlearning—short, focused lessons that fit into busy lives. From language apps to coding challenges, learners can study anytime, anywhere. This flexibility empowers students to build skills continuously rather than waiting for scheduled classroom hours.
AI and Personalized Learning: Tailoring Education to the Individual
One of the most revolutionary developments in education technology is the rise of artificial intelligence. AI-driven systems analyze learning behavior, identify strengths and weaknesses, and customize resources to match each student’s needs.
1. Adaptive Learning Platforms
Adaptive learning tools adjust lesson difficulty, pacing, and content automatically. If a student struggles with algebraic equations, the system slows down, offers hints, or suggests foundational exercises. If the student excels, it advances them faster.
This ensures:
-
no student is left behind
-
advanced learners are not held back
-
teachers have better insight into individual progress
2. AI Tutors and Virtual Assistants
Digital assistants powered by AI help students practice languages, understand math concepts, or prepare for exams. Unlike humans, they are available 24/7, patient, and able to provide unlimited practice.
In classrooms, AI assists teachers by:
-
grading assignments
-
generating quizzes
-
analyzing class performance trends
-
recommending intervention strategies

3. Intelligent Content Creation
AI tools can now produce study guides, explanations, and practice problems tailored to specific learning goals. This reduces teacher workload while enriching learning materials with diverse examples and formats.
Immersive Technologies: Learning Through Experience
Immersive technologies such as virtual reality (VR), augmented reality (AR), and mixed reality (MR) take education beyond reading and listening—they let students experience knowledge firsthand.
1. Virtual Reality in the Classroom
VR enables students to:
-
walk through ancient civilizations
-
explore human anatomy in 3D
-
simulate laboratory experiments
-
travel through space or deep oceans
These experiences deepen understanding by transforming abstract concepts into vivid, memorable environments.
2. Augmented Reality for Interactive Learning
AR overlays digital information onto the real world. Students can scan textbooks to see 3D models, solve puzzles on classroom walls, or use mobile apps to visualize physics and geometry concepts.
3. Simulation-Based Learning
Fields like medicine, aviation, engineering, and chemistry rely heavily on simulations. Learners can practice surgeries, fly virtual aircraft, or test circuits safely—building skills through repetition without real-world risk.
Cloud Collaboration and the Global Classroom
Cloud computing has made collaboration instantaneous and borderless. Students and educators connect across continents, sharing ideas and working on projects in real time.
1. Cloud-Based Tools for Collaboration
Platforms like Google Workspace, Microsoft Teams, and Notion allow:
-
shared documents
-
real-time editing
-
digital whiteboards
-
group discussions
-
project management
Students develop teamwork, digital literacy, and organizational skills essential for modern careers.
2. Global Learning Communities
The rise of international virtual classrooms means students can exchange cultural perspectives, participate in global debates, and work on joint research projects with peers worldwide. This exposure builds cultural intelligence and prepares learners for globalized careers.
Digital Literacy: The New Educational Foundation
As technology becomes integral to every industry, digital literacy is now as important as reading and math. Schools must teach students how to navigate digital spaces safely, ethics-driven, and effectively.
Key digital skills include:
-
understanding cybersecurity basics
-
evaluating online information critically
-
using productivity tools
-
learning foundational coding
-
managing digital identity and privacy
-
communicating effectively online
Educators now play a dual role: teaching academic content and guiding students to become responsible digital citizens.
EdTech Challenges: Bridging Gaps to Build a Better Future
Despite tremendous progress, technology in education faces significant challenges.
1. The Digital Divide
Not all students have equal access to devices or high-speed internet. Bridging this gap is crucial to ensuring equity in education.
2. Information Overload
With unlimited content available, students may feel overwhelmed. Curated learning pathways and teacher guidance remain essential.
3. Privacy and Security Concerns
Platforms collect data to personalize learning, but this requires strong safeguards to protect student information.
4. Teacher Training and Support
Technology is only effective when educators know how to use it. Ongoing training and digital skill development are vital.
The Future of Tech-Driven Education
As innovation accelerates, the future of education is likely to embrace:
● Lifelong learning ecosystems
Education becomes continuous, flexible, and individualized—supporting people through every stage of life.
● AI-powered mentors
Personal learning assistants guiding students from childhood to career.
● Fully immersive classrooms
VR and AR integrated into daily lesson plans.
● Skills-based education
A shift from rote memorization to creativity, problem-solving, and critical thinking.
● More inclusive and accessible learning
Tools designed for learners with disabilities, language barriers, or special needs.

Conclusion
Technology is not replacing education—it is elevating it. Through AI, immersive experiences, global connectivity, and personalized pathways, students today have opportunities that were unimaginable just a decade ago. The challenge and responsibility now lie in using these tools ethically, inclusively, and creatively to build an educational future that empowers every learner.
In this new era, education becomes more than knowledge delivery—it becomes a dynamic, lifelong journey shaped by curiosity, innovation, and the limitless possibilities of technology.

Education has always been a cornerstone of human progress, but the methods we use to teach and learn have changed dramatically throughout history. From chalkboards and printed textbooks to interactive smartboards and digital platforms, technology has consistently reshaped the way knowledge is shared. In today’s world, the fusion of technology and education is more powerful than ever, redefining classrooms, expanding access, and preparing learners for an increasingly digital future.
This article explores how technology is transforming education, the opportunities it creates, the challenges it poses, and what the future of tech-enabled learning might look like.
1. The Digital Classroom
The concept of the classroom has evolved far beyond four walls. Technology has made learning more interactive, accessible, and personalized.
-
Smart Classrooms: Interactive whiteboards, tablets, and projectors bring lessons to life with visuals, simulations, and real-time collaboration.
-
Learning Management Systems (LMS): Platforms such as Moodle, Canvas, or Google Classroom allow teachers to share materials, assign homework, and provide feedback digitally.
-
Flipped Classrooms: Students now access lectures online before class and use in-person time for discussions, problem-solving, and group work.
The digital classroom enhances engagement and makes learning more adaptable to different styles.
2. E-Learning and Remote Education
The COVID-19 pandemic accelerated a global shift toward online education, proving that technology could sustain learning even in challenging circumstances. While initially seen as an emergency solution, online learning is now recognized as a permanent part of education.
-
Online Platforms: Coursera, Udemy, edX, and Khan Academy offer high-quality courses accessible worldwide.
-
Video Conferencing Tools: Zoom, Microsoft Teams, and Google Meet have become staples for lectures and seminars.
-
Asynchronous Learning: Students can learn at their own pace with recorded lectures, interactive modules, and discussion boards.
Remote learning has opened doors for people who once faced barriers due to geography, finances, or accessibility.
3. Artificial Intelligence in Education
Artificial Intelligence (AI) is one of the most significant technological advancements shaping education. Its applications are vast and rapidly growing:
-
Personalized Learning: AI analyzes student performance and adapts lessons to individual needs. For example, adaptive software adjusts difficulty levels in math problems based on student progress.
-
Tutoring Systems: AI-driven chatbots can act as virtual tutors, answering student questions outside of class hours.
-
Grading and Administration: AI can automate grading multiple-choice tests and even evaluate essays, reducing teacher workload.
Although AI offers powerful tools, it also raises questions about data privacy, algorithmic bias, and the importance of human interaction in education.

4. Virtual Reality (VR) and Augmented Reality (AR)
VR and AR are turning learning into immersive experiences that were once unimaginable.
-
Virtual Reality: Students can explore ancient civilizations, dive into the human bloodstream, or walk on Mars—all through VR headsets.
-
Augmented Reality: Apps overlay digital information onto the physical world. For example, AR can show interactive 3D models of anatomy when scanning a textbook image.
-
Skill Training: VR is widely used in vocational training, such as flight simulation for pilots or virtual labs for medical students.
These technologies make complex concepts more tangible, engaging, and memorable.
5. Gamification of Learning
Gamification integrates game-like elements into education, making learning more fun and motivating.
-
Points, Badges, and Leaderboards: These reward systems encourage students to participate and track progress.
-
Educational Games: Apps like Duolingo (for language learning) or Kahoot! (for classroom quizzes) show how gamification boosts engagement.
-
Problem-Solving Through Play: Simulation games encourage critical thinking, teamwork, and creativity.
Gamification transforms learning from passive memorization into active participation.
6. Bridging the Digital Divide
While technology offers immense benefits, not everyone has equal access. The digital divide remains one of education’s greatest challenges.
-
Access to Devices: Many students in rural or low-income areas lack laptops, tablets, or reliable internet.
-
Infrastructure Gaps: Even in developed countries, poor connectivity can limit access to online education.
-
Digital Literacy: Students and teachers alike need training to effectively use new tools.
Closing the digital divide requires investment in infrastructure, affordable devices, and inclusive policies. Without this, technology risks widening, rather than closing, educational gaps.
7. Data, Analytics, and Personalized Education
Education has become increasingly data-driven. Analytics help schools and universities understand student progress and make evidence-based decisions.
-
Learning Analytics: Platforms track student behavior—such as time spent on lessons or quiz performance—helping educators identify strengths and weaknesses.
-
Early Intervention: Data can flag at-risk students who may need additional support before they fall behind.
-
Customized Curriculum: Analytics allow for tailored courses that better fit student needs, making education more relevant and effective.
Handled responsibly, data-driven education ensures better outcomes and more equitable learning.
8. Lifelong Learning and the Future Workforce
Technology is not just changing education for children and university students—it’s transforming how adults learn and adapt.
-
Upskilling and Reskilling: Workers use online platforms to learn new skills in response to automation and changing industries.
-
Micro-Credentials: Short, skill-focused certifications allow learners to prove expertise without pursuing full degrees.
-
Global Collaboration: Online communities connect learners worldwide, breaking down barriers of geography and culture.
In the future, education will be seen as a lifelong journey rather than something confined to early life. Technology ensures that knowledge remains accessible at every stage.
9. Challenges of Technology in Education
Despite its many benefits, technology in education presents real challenges:
-
Screen Fatigue: Excessive screen time can cause eye strain and reduce focus.
-
Over-Reliance on Technology: Students may lose critical thinking or interpersonal skills if technology dominates learning.
-
Cybersecurity Risks: Educational institutions are vulnerable to data breaches and online harassment.
-
Equity Issues: Without careful implementation, technology may reinforce social inequalities.
These challenges require thoughtful strategies to ensure technology enhances education rather than hinders it.
10. The Future of Tech-Enabled Education
Looking ahead, the integration of technology and education will only deepen. Some trends to watch include:
-
Artificial Intelligence Tutors: AI may become sophisticated enough to provide near-human tutoring experiences.
-
Blockchain Credentials: Secure digital diplomas and certificates may replace traditional paper qualifications.
-
Global Classrooms: Students from different countries could collaborate seamlessly in shared online learning environments.
-
Hybrid Learning Models: A mix of in-person and online education will likely become the global norm.
The ultimate goal will be to use technology not as a replacement for teachers but as a powerful partner in creating meaningful learning experiences.

Conclusion
Technology and education are no longer separate spheres—they are deeply intertwined. From digital classrooms and online platforms to AI tutors and VR simulations, technology has redefined how people learn and teach. It offers unprecedented opportunities for personalization, access, and innovation.
At the same time, challenges like the digital divide, screen fatigue, and privacy concerns remind us that education must remain centered on human needs. Technology is a tool, not a substitute for the empathy, creativity, and guidance that teachers bring.
As we look to the future, one thing is clear: the fusion of technology and education is not just transforming classrooms—it is reshaping society itself. By embracing innovation while prioritizing inclusivity and ethics, we can build a learning ecosystem that empowers people everywhere, at every stage of life.
The health and wellness industry are thriving, and supplement brands are at the forefront of this growth. But how do these brands stand out in a crowded marketplace and build consumer trust? The secret lies in strategic marketing.
From leveraging the power of search engine optimization (SEO) to forming authentic connections through influencers, successful supplement brands use a mix of tactics to capture attention and convert interest into sales. Here’s a closer look at how these strategies work and what you can learn from them.
The Power of SEO in Driving Organic Traffic
Search engine optimization (SEO) is one of the most cost-effective ways to attract customers to your website. By optimizing your site for specific keywords like “best protein powder” or “natural vitamin D supplements,” or “cjc-1295 dac 10mg”you can rank higher on search engine results pages (SERPs). This helps drive organic traffic, bringing potential buyers directly to your virtual doorstep.
Take Garden of Life, for instance. This supplement brand has built a highly effective SEO strategy by publishing blog content that answers health-related questions consumers often search for. Articles like “The Benefits of Probiotics” educate consumers and improve the brand’s visibility on Google. By providing helpful, keyword-optimized content, Garden of Life strengthens its credibility while driving traffic to its site.
The first step for brands looking to boost their SEO is conducting thorough keyword research using tools like Google Keyword Planner or SEMrush. Once you’ve identified high-impact keywords, optimize your website’s meta titles, descriptions, and blog posts. Don’t forget to focus on technical SEO as well, make sure your site is fast, mobile-friendly, and easy to navigate.
Building Trust Through Influencer Marketing
Influencers have become a huge force in the supplement market. Why? People trust influencers. When a fitness trainer or wellness advocate recommends a product, their followers are likelier to believe it’s worth trying. Influencers bridge the gap between brands and consumers, offering a sense of authenticity that traditional ads often lack.
Consider Athletic Greens, a greens powder brand that’s mastered the art of influencer marketing. The brand has built significant credibility by partnering with popular podcasters, fitness enthusiasts, and lifestyle influencers. These partnerships often involve honest product reviews, testimonial-style posts, and discount codes, which excite consumers to try the product.
Finding someone whose values align with your brand is the key to effective influencer marketing. Micro-influencers, who typically have between 10,000 and 100,000 followers, can offer higher engagement rates than celebrity influencers. For example, a yoga instructor with a small but loyal following may create a more genuine connection with your target audience than a world-famous athlete.
Content Marketing That Educates and Converts
Content marketing goes hand in hand with SEO but deserves its spotlight. A well-crafted blog, eBook, or video can build brand authority and nurture leads. The key is to provide value to your audience.
For example, brands like NOW Foods publish well-researched guides on topics like “How to Choose the Right Supplements for Your Goals.” This establishes NOW Foods as an authority and helps consumers make informed decisions, earning their trust in the long run.
Beyond blogs and guides, long-form video content can showcase how your products fit into consumers’ lives. Recipe videos featuring protein powders or step-by-step tutorials on creating a supplement routine can add an extra layer of engagement. Visual content, such as infographics and branded animations, can also make more complex scientific information—like the benefits of omega-3 fatty acids—digestible and shareable for your audience.
Leveraging Email Marketing for Retention and Upsells
Email marketing remains a vital tool for supplement brands. It’s not just about acquiring new customers; it’s about keeping existing customers engaged and loyal. Emails allow you to promote seasonal sales, share valuable health tips, and introduce new products.
Take Ritual, a subscription-based supplement brand. Ritual creates personalized emails catering to users’ specific health goals. They send regular updates, friendly reminders about subscription renewals, and educational content about what goes into their vitamins. This nurturing approach makes customers feel like more than just a transaction.
To get started with email marketing, invest in tools like Mailchimp or Klaviyo to create automated campaigns. Always segment your email lists to send the right message to the right audience. For example, customers who recently bought a pre-workout supplement might appreciate tips on optimizing their fitness routines.
Social Media Advertising to Broaden Reach
Social media platforms like Instagram, Facebook, and TikTok provide fertile ground for advertising supplement goods. Facebook ads allow you to target users based on their interests, while Instagram Stories can use eye-catching visuals to highlight your product. TikTok, on the other hand, provides opportunities to go viral with creative, relatable content.
OLLY, a vitamin brand known for its colorful packaging, has expertly used Instagram to showcase its playful brand personality. Their mix of vibrant visuals, customer testimonials, and educational posts create an engaging presence that attracts new buyers daily.
For effective social media advertising, experiment with formats like carousel ads, allowing you to feature multiple products simultaneously. Use user-generated content (UGC) to amplify social proof and be sure to monitor performance metrics to tweak campaigns as needed.
-
 Education2 years ago
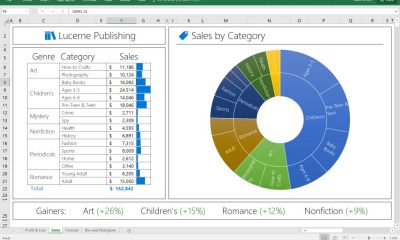
Excel Sunburst Chart
-

 Excel for Business2 years ago
Interactive Excel KPI Dashboard
-

 Education2 years ago
Fix Microsoft Excel Error – PivotTable Field Name Is Not Valid
-

 Education2 years ago
Positive Negative Bar Chart
-

 Education2 years ago
Excel Gantt Chart (Conditional Formatting)
-

 Education2 years ago
Streamlining Election Vote Counting with an Excel Election Template
-

 Excel for Business2 years ago
Mastering Chart Elements in Excel to Unlock Better Data Visualization
-

 Education2 years ago
Mastering Excel’s Hidden Power with Volatile Functions